
Nine European leagues, 59,783 matches, 21 completed seasons from 2005/06 to 2025/26, recounted from match records on 15 November 2026.
Key takeaways
- Cards per game fall through every season we hold, from 4.18 in a season's opening third to 3.88 in its closing third. That is a drop of 0.296 cards a game, or 7.1 per cent, across 59,783 matches.
- It is not a fluke of one league or one year. The last third came in below the first third in 21 of 21 seasons and in 9 of 9 leagues. The Eredivisie drops 17.8 per cent, the Premier League 10.6 per cent, La Liga the least at 3.7 per cent.
- The same officials card less later on. Of the 55 referees with at least 50 matches in both windows, 45 carded less in the closing third, a mean drop of 0.294 cards a game (t = 6.75). Appointment mix does not explain it.
- Over 3.5 cards lands 58.9 per cent of the time in the opening third and 52.9 per cent in the closing third, fair odds of 1.70 against 1.89. A single season long line is wrong at both ends of the calendar.
- December is not the card month. October is, at 4.25 cards a game, with September just behind. December sits at 4.09, barely above the 4.04 average, and May is the quietest month at 3.79.
On this page
- Cards per game by season stage, the whole dataset
- The decline is a slope, not a cliff
- Nine leagues, nine declines
- October, not December, is the card month
- The same whistle, eight months later
- Fewer fouls, or a softer whistle?
- What the drift is worth on a card line
- 2026/27 so far: England hot, Italy cold
- How we counted, and what this does not cover
- Related reading
Every card guide on the internet quotes you a cards per game figure for a league and leaves it there, as though a fixture in August and a fixture in May were drawn from the same bag. They are not. We counted every booking in 59,783 league matches since 2005/06 and the rate falls steadily from the opening weeks to the closing ones, in every league we hold and in every season we hold.
The size of it matters for anyone pricing a card market. Over 3.5 cards is a 58.9 per cent shot in a season's first third and a 52.9 per cent shot in its last, a six point swing that no referee read will rescue you from if your baseline is a season long average. On a 1.80 line that is the difference between a bet with an edge and a bet with a hole in it.
This page gives the drift by thirds, by tenths, by league and by calendar month, then tests it the only way that settles the question: by following the same officials across the season rather than comparing the ones who happen to work in August against the ones who happen to work in May. Every figure here is recounted from football-data.co.uk match records, the same match level source behind our referee profiles, rather than copied from anyone's summary table.
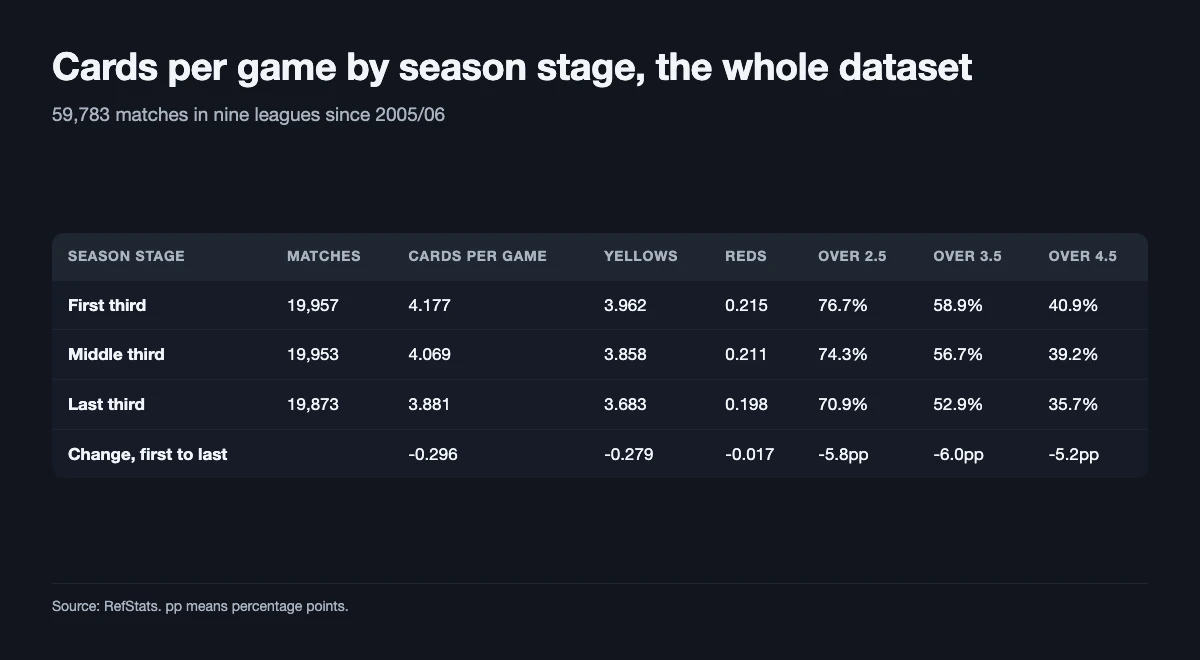
Cards per game by season stage, the whole dataset
We split every league season into three equal windows by date order, so the first third is roughly matchweeks 1 to 13 of a 38 game season and the last third roughly matchweeks 26 to 38. Pooling all nine leagues and all 21 seasons gives three samples of almost exactly 20,000 matches each.
| Season stage | Matches | Cards per game | Yellows | Reds | Over 2.5 | Over 3.5 | Over 4.5 |
|---|---|---|---|---|---|---|---|
| First third | 19,957 | 4.177 | 3.962 | 0.215 | 76.7% | 58.9% | 40.9% |
| Middle third | 19,953 | 4.069 | 3.858 | 0.211 | 74.3% | 56.7% | 39.2% |
| Last third | 19,873 | 3.881 | 3.683 | 0.198 | 70.9% | 52.9% | 35.7% |
| Change, first to last | -0.296 | -0.279 | -0.017 | -5.8pp | -6.0pp | -5.2pp |
Yellows carry the drop, falling 0.279 a game, and reds come down with them, from 0.215 to 0.198. Nothing here is a rounding artefact: these are three samples of 20,000 matches, and the gap between the first and last window is more than ten times its own standard error.
The useful way to hold this is that a season does not have one card rate, it has a downward sloping one. The next section shows how smooth that slope is.
The decline is a slope, not a cliff
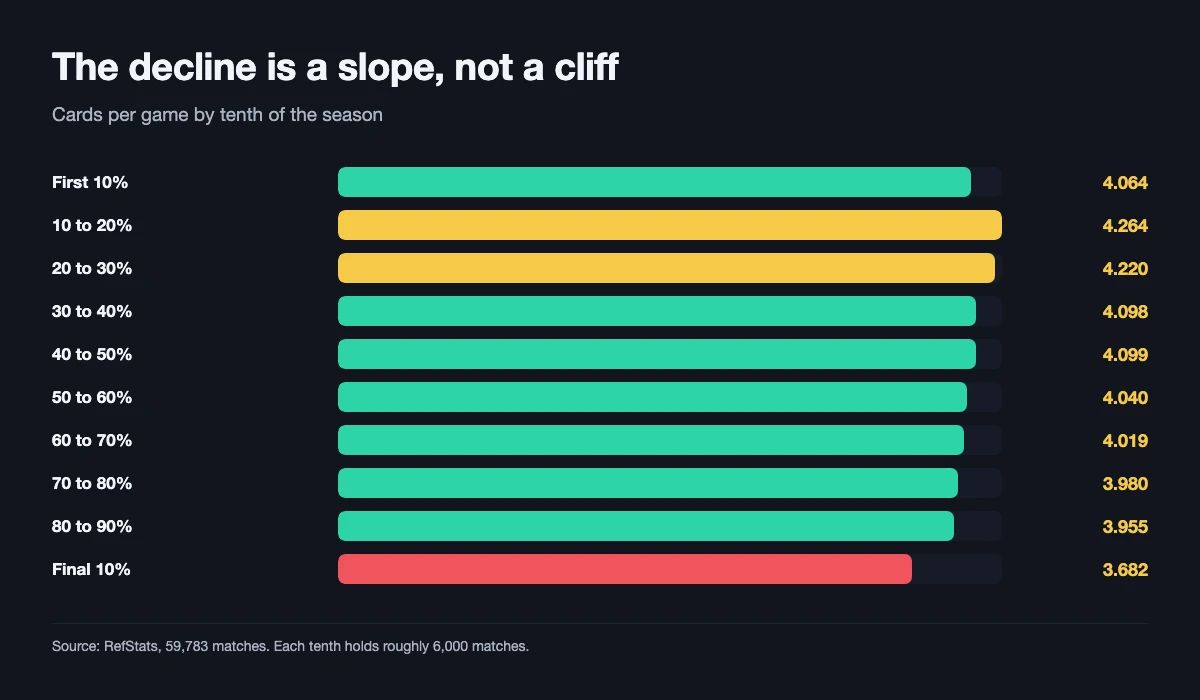
Thirds are a blunt instrument, so we cut each league season into ten equal windows instead. If the pattern were really about one disrupted stretch of the calendar, a fixture pile up or an international break, it would show as a step. It does not.
| Stage of season | Matches | Cards per game |
|---|---|---|
| First 10% | 6,017 | 4.064 |
| 10 to 20% | 5,994 | 4.264 |
| 20 to 30% | 5,955 | 4.220 |
| 30 to 40% | 5,994 | 4.098 |
| 40 to 50% | 5,935 | 4.099 |
| 50 to 60% | 6,015 | 4.040 |
| 60 to 70% | 5,995 | 4.019 |
| 70 to 80% | 5,954 | 3.980 |
| 80 to 90% | 5,995 | 3.955 |
| Final 10% | 5,929 | 3.682 |
Two things stand out. The peak is not the opening weekend but the second tenth, around matchweeks 4 to 8, at 4.264. Opening fixtures are slightly quieter than the weeks that follow them, which fits a league finding its rhythm rather than referees arriving with a new rulebook on day one.
Then the final tenth falls off a step, to 3.682, the lowest reading on the table by a clear margin. The last three or four matchweeks of a season behave differently from everything before them, and that is where the dead rubber explanation below has the most to answer for.
Nine leagues, nine declines
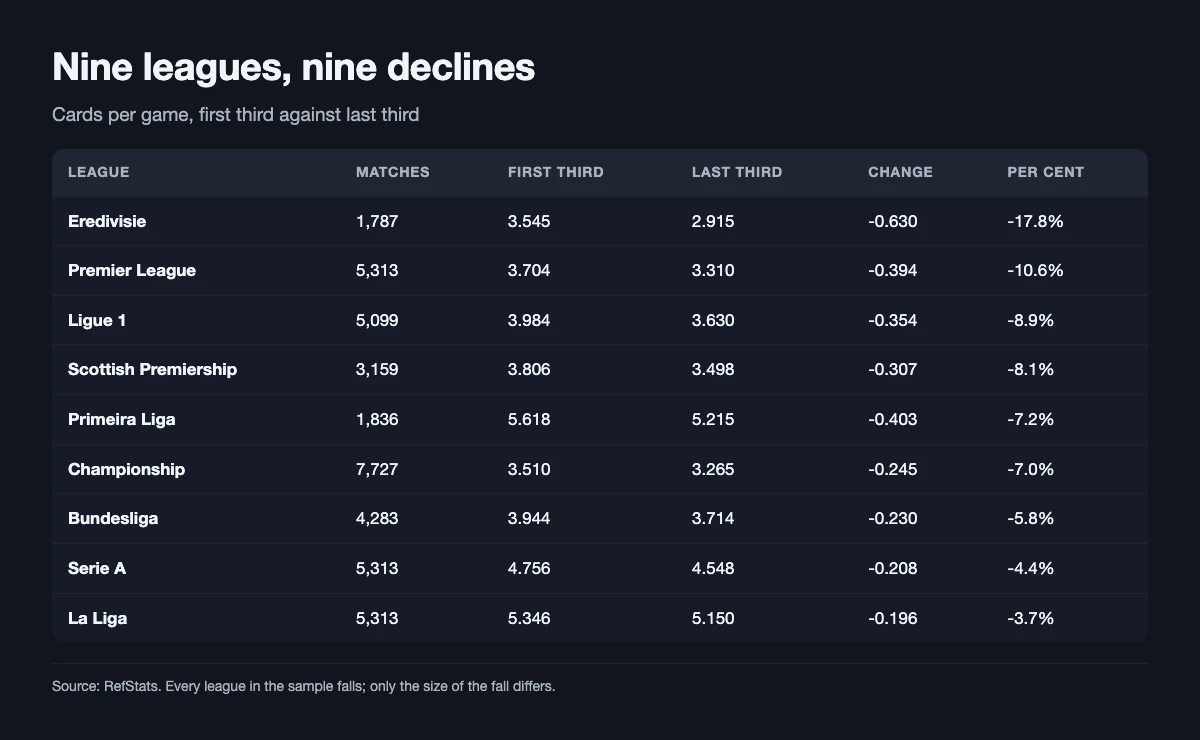
A pooled average can hide a pattern driven by one or two outliers, so here is every league on its own. We are using each league's own first and last third, so a winter break or a compressed calendar cannot move a league up or down this table.
| League | Matches | First third | Last third | Change | Per cent |
|---|---|---|---|---|---|
| Eredivisie | 1,787 | 3.545 | 2.915 | -0.630 | -17.8% |
| Premier League | 5,313 | 3.704 | 3.310 | -0.394 | -10.6% |
| Ligue 1 | 5,099 | 3.984 | 3.630 | -0.354 | -8.9% |
| Scottish Premiership | 3,159 | 3.806 | 3.498 | -0.307 | -8.1% |
| Primeira Liga | 1,836 | 5.618 | 5.215 | -0.403 | -7.2% |
| Championship | 7,727 | 3.510 | 3.265 | -0.245 | -7.0% |
| Bundesliga | 4,283 | 3.944 | 3.714 | -0.230 | -5.8% |
| Serie A | 5,313 | 4.756 | 4.548 | -0.208 | -4.4% |
| La Liga | 5,313 | 5.346 | 5.150 | -0.196 | -3.7% |
Nine leagues, nine declines, no exceptions. The spread is the interesting part: the two highest carding leagues in Europe, La Liga and the Primeira Liga, are the two that drift least in percentage terms, while the Premier League sheds more than a tenth of its card rate between August and May. If you cross apply an English prior to a Spanish fixture in April you are wrong twice over, once on the level and once on the drift.
Season stage sits alongside the league baseline, not instead of it. Our ranking of which league has the most cards is still the first number to reach for; this page tells you which way it is moving by the time your fixture kicks off.
October, not December, is the card month
The folklore says the festive pile up is when referees lose patience: congested fixtures, tired legs, tempers up. One of the few published attempts at a monthly breakdown claims exactly that, a December peak. Our records do not support it.
| Month | Matches | Cards per game |
|---|---|---|
| August | 4,693 | 3.937 |
| September | 5,873 | 4.230 |
| October | 6,044 | 4.251 |
| November | 5,682 | 4.021 |
| December | 6,742 | 4.085 |
| January | 5,793 | 4.017 |
| February | 6,736 | 4.058 |
| March | 5,935 | 3.974 |
| April | 7,040 | 3.973 |
| May | 4,569 | 3.793 |
October is the card month at 4.251, with September at 4.230. December, at 4.085, is 0.166 cards a game below October and only 0.043 above the 4.042 all months average. The quietest month is May at 3.793, which is also the month that decides titles and relegations, so the "cards rise when the stakes rise" story has the calendar against it too.
August is the one month that reads lower than the season stage story would predict, at 3.937. That is the same effect as the opening decile above: the very start of a season is calmer than the six weeks that follow it. Treat the autumn, not the opening weekend, as the high water mark.
Put a card read to work
Cards, results and totals on football markets, priced by traders rather than a bookmaker's margin. Open Polymarket
18+. Trading involves risk. That is an affiliate link, not betting advice.
The same whistle, eight months later
Here is the objection that could sink everything above. Appointments are not random. If the officials who work the closing weeks are systematically more lenient than the ones who work the autumn, the drift is an artefact of who was given the whistle, not of anything about the season.
So we tested it within officials. For every referee with at least 50 matches in a season's first third and 50 in its last third, we compared that referee against himself. Fifty five officials clear the bar.
| Measure | Result |
|---|---|
| Officials qualifying | 55 |
| Carded less in the last third | 45 of 55 (82%) |
| Mean change in cards per game | -0.294 |
| Standard error of that mean | 0.044 |
| t statistic | 6.75 |
| Largest drop | Bobby Madley, 4.21 to 3.19 |
| Largest rise | Bobby Madden, 2.80 to 3.18 |
The effect survives, at essentially the same size as the pooled figure. Eighty two per cent of officials card less late in a season than they do early in one, and the average official sheds 0.294 cards a game, which is the 7 per cent drift again. This is a thing referees do, not a thing appointment schedules do to them.
The individual spreads are wider than the average suggests. Peter Bankes goes from 4.69 to 3.76 across 173 matches, Simon Hooper from 3.89 to 3.11 across 222, and Tim Robinson from 4.38 to 3.67 across 202. Ten officials move the other way, Steven McLean and Bobby Madden among them, which is roughly what you would expect from chance in a sample of 55 if the true effect were negative for most of them. Individual referee pages carry each official's own season splits.
Fewer fouls, or a softer whistle?
A falling card rate can come from two places: fewer offences, or the same offences punished less often. The match records carry foul counts as well as cards for 59,011 of our matches, so this is answerable rather than arguable.
| Season stage | Matches | Fouls per game | Cards per game | Fouls per card |
|---|---|---|---|---|
| First third | 19,701 | 26.48 | 4.18 | 6.34 |
| Middle third | 19,689 | 26.32 | 4.07 | 6.46 |
| Last third | 19,621 | 25.72 | 3.88 | 6.61 |
Fouls fall, but only by 2.9 per cent, while cards fall by 7.1 per cent. The gap goes into the conversion rate: it takes 6.34 fouls to produce a card in a season's first third and 6.61 by its last, a 4.3 per cent softening. So roughly two fifths of the drift is players committing fewer offences and three fifths is referees reaching for the pocket less often for the offences that are committed.
Why that happens is not something this dataset can settle, and we are not going to pretend otherwise. Three explanations fit the shape. New season directives get applied strictly in August and September and relax as the campaign wears on. Squads and referees learn each other. And by the closing weeks a growing share of fixtures has nothing riding on it, which the sharp fall in the final tenth above would support.
One popular explanation does not fit. The accumulation thresholds would have players at their most careful early: under The FA's accumulated caution rules, five cautions up to and including a club's 19th league match brings a one match ban, ten up to the 32nd brings two. If threshold pressure drove behaviour, the autumn would be the quiet period. It is the loud one.
What the drift is worth on a card line
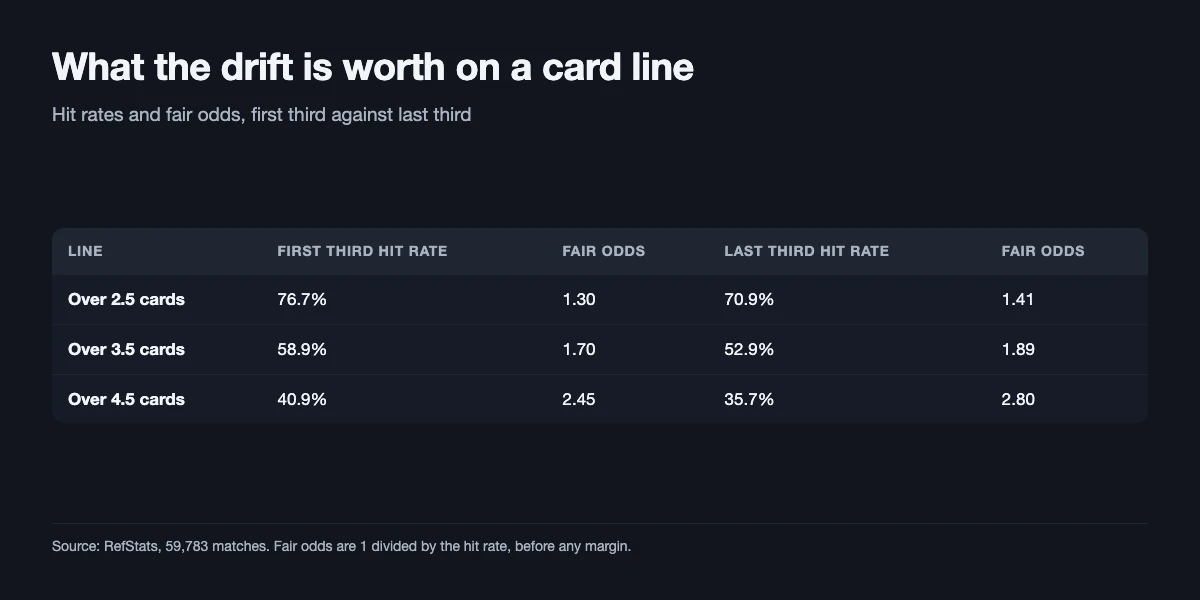
Convert the hit rates into the odds they demand and the cost of ignoring season stage becomes a number. These are fair prices, before any margin.
| Line | First third hit rate | Fair odds | Last third hit rate | Fair odds |
|---|---|---|---|---|
| Over 2.5 cards | 76.7% | 1.30 | 70.9% | 1.41 |
| Over 3.5 cards | 58.9% | 1.70 | 52.9% | 1.89 |
| Over 4.5 cards | 40.9% | 2.45 | 35.7% | 2.80 |
Over 4.5 cards needs 2.45 in the autumn and 2.80 in the spring. A book quoting one price all season is offering you value at one end of the calendar and taking it back at the other, and the gap is 14 per cent of the stake on that line. Our over 4.5 cards hit rates page prices the same market by league and referee; stack the season stage adjustment on top of the league baseline rather than instead of it.
Two cautions on using this. The drift is an average across 21 seasons, not a rule for your fixture, and a single match still turns mostly on the referee and the tie. And card markets are not always settled on raw card counts: many books use booking points, where a red is worth more than a yellow, so convert before you compare.
2026/27 so far: England hot, Italy cold
Season stage is a prior, and the current campaign is the evidence to set against it. Here is every league's 2026/27 record to 8 November 2026 against its own historical first third baseline, which is the fair comparison because we are only a third of the way in.
| League | 2026/27 matches | Now | First third baseline | Difference |
|---|---|---|---|---|
| Premier League | 100 | 4.310 | 3.704 | +0.606 |
| Championship | 180 | 3.917 | 3.510 | +0.407 |
| Scottish Premiership | 75 | 3.973 | 3.806 | +0.168 |
| Bundesliga | 81 | 3.827 | 3.944 | -0.117 |
| Ligue 1 | 90 | 3.622 | 3.984 | -0.362 |
| Eredivisie | 108 | 3.083 | 3.545 | -0.461 |
| La Liga | 119 | 4.689 | 5.346 | -0.657 |
| Primeira Liga | 98 | 4.551 | 5.618 | -1.067 |
| Serie A | 110 | 3.364 | 4.756 | -1.392 |
The two English leagues are running hot. The Premier League's 4.310 over 100 matches is 0.61 above its own autumn baseline, a gap of roughly three standard errors, so it is unlikely to be pure noise. Our Premier League referee card stats page has the official by official detail behind it.
Italy and Portugal are running cold, and heavily so: Serie A at 3.364 is nearly a card and a half a game below its long run autumn figure. Some of that is the long decline in Italian bookings rather than this season alone. The practical read is that the seasonal drift still has to be applied on top of whatever the current campaign is doing, and in England right now those two pull in opposite directions.
How we counted, and what this does not cover
The sample is every completed league fixture with card records in the nine leagues behind our referee pages, 2005/06 to 2025/26, from football-data.co.uk, downloaded on 15 November 2026: 59,783 matches and 241,667 cards, 229,248 yellow and 12,419 red. A card is a yellow or a red counted once, which is the convention used across our card guides. Figures for 2026/27 run to 8 November 2026.
Four limitations worth stating plainly.
- Coverage is uneven. Card columns begin in 2017/18 for the Eredivisie and the Primeira Liga, so each contributes under 2,000 matches to the league table above against more than 5,000 for the Premier League. We excluded 6,821 match rows that carried no card data rather than treating a blank as a zero.
- Thirds are by date order, not by matchweek. A postponed fixture played in April sits in the window it was played in, which is the right call for a question about when cards are shown but means our thirds are not exactly matchweeks 1 to 13, 14 to 25 and 26 to 38.
- We did not test the cause. The dead rubber explanation is the most plausible of the three above and we cannot check it without league positions by matchweek, which this dataset does not carry.
- No minute level data. These records carry match totals only, so nothing here splits by half. A Law 12 caution in the 3rd minute and one in the 93rd count the same.
Everything above is computed from match records rather than quoted, and the full method behind our aggregates is on the methodology page. The Premier League referee list carries per official season splits if you want to apply this to a specific appointment.
Related reading
- Which league has the most cards? 2026 referee data, the league baselines this drift applies on top of.
- Over 4.5 cards hit rates 2026, every total cards line priced by league and referee.
- Premier League referee card stats 2026/27, who cards most among the current officials.
- Referee home bias 2026, why away teams take 54 per cent of the cards.
- How card markets are priced, lines, margins and appointment news.
- Booking points explained, converting cards into the scoring books actually use.