
Key takeaways
- The Premier League has shown 19 red cards in the first 100 matches of 2026/27, a rate of 0.190 per game against a 21 season average of 0.140. On that pace the season finishes with 72, the most since 2005/06.
- The spike is real against last season and unproven against history. Last season's 0.103 rate makes 19 reds a one in 109 event, but the long run rate of 0.140 makes it a one in eight event. A 100 match sample puts the true rate somewhere between 0.105 and 0.275.
- The Championship and the Scottish Premiership are both running below their own baselines, 0.117 against 0.146 and 0.133 against 0.206. Whatever is happening is happening in one division, so it is not a change in the laws.
- John Brooks and Chris Kavanagh have four red cards each from seven matches. Their records since 2005/06 are 0.122 and 0.114 per game, so both are running at roughly five times their own career rate.
- Away players take 57.5 per cent of Premier League red cards against 54.5 per cent of yellows. The sending off is the most home biased card decision in the data.
On this page
- The Premier League red card baseline, 21 seasons deep
- Premier League red card stats by season since 2005/06
- 2026/27 is running hot, and 100 matches cannot prove it
- Two other leagues say this is not a rule change
- Premier League red card stats by referee, 2026/27
- Career sending off rates, and why Mike Dean's total moves
- Away players take 57 per cent of the red cards
- Turning a red card rate into a priced bet
- Why our count says 39 and other trackers say 44
- What these red card stats cannot tell you
Every public red card tracker will tell you how many players have been sent off this season, and not one of them will tell you whether that number is high. Premier League red card stats for 2026/27 open at 19 dismissals in 100 matches, which is 0.190 per game, and the only way to know what that means is to put it beside the 1,120 red cards shown in the previous 21 seasons. We counted every one of them from the match records, reconciled our yellow card total for last season to within a single card of an independent tracker, and checked the same period in two other leagues that publish referee names. The short version is that the rate has almost doubled off a record low, that it is specific to this division, and that it is still inside the range a 100 match sample can produce by chance.
The Premier League red card baseline, 21 seasons deep
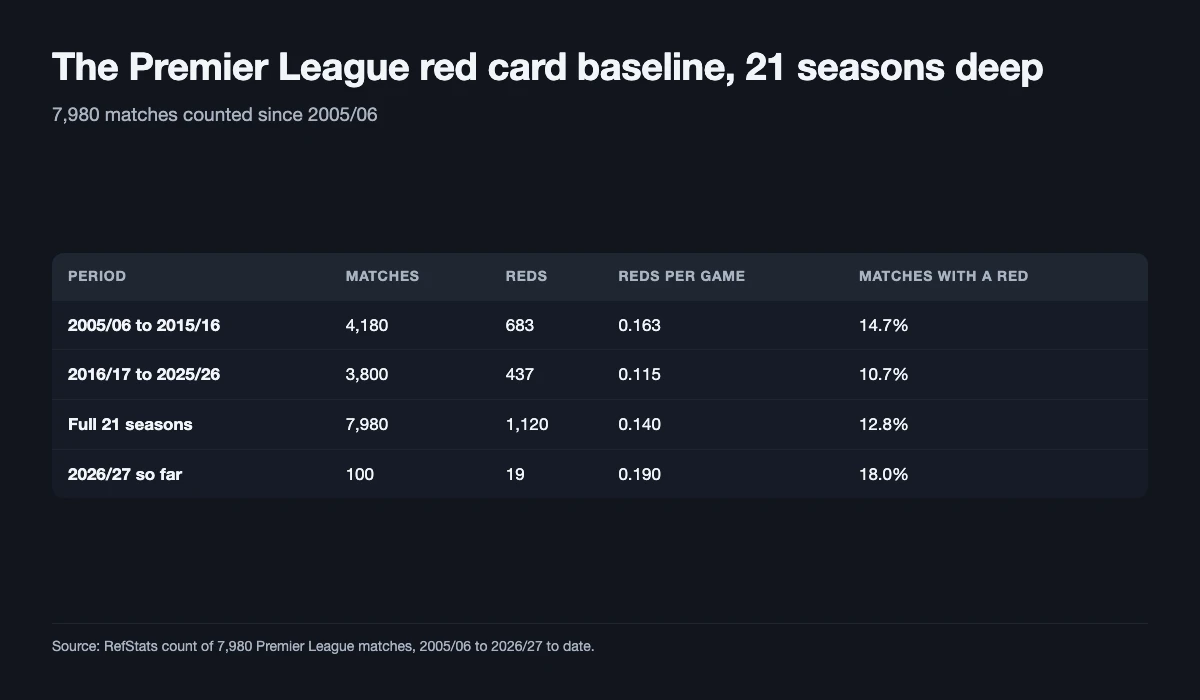
A red card is a rare event, and that is the first thing any price has to respect. Across the 7,980 Premier League matches played from 2005/06 to 2025/26 there were 1,120 dismissals, which is 0.140 per game. Because reds cluster, the more useful number is the share of matches that contain at least one: 12.78 per cent, or a little better than one match in eight.
That average hides a structural break. The first eleven seasons of the period ran at 0.163 per game and the last ten at 0.115, a decline of just under 30 per cent. Fouls did not fall with them, which is why the drop is better read as a change in tolerance than a change in behaviour.
| Period | Matches | Reds | Reds per game | Matches with a red |
|---|---|---|---|---|
| 2005/06 to 2015/16 | 4,180 | 683 | 0.163 | 14.7% |
| 2016/17 to 2025/26 | 3,800 | 437 | 0.115 | 10.7% |
| Full 21 seasons | 7,980 | 1,120 | 0.140 | 12.8% |
| 2026/27 so far | 100 | 19 | 0.190 | 18.0% |
Those four rows are the whole argument of this page. The current season is not being compared with a vague memory of how often players used to be sent off, it is being compared with a counted baseline, and the baseline itself moved once already.
Premier League red card stats by season since 2005/06
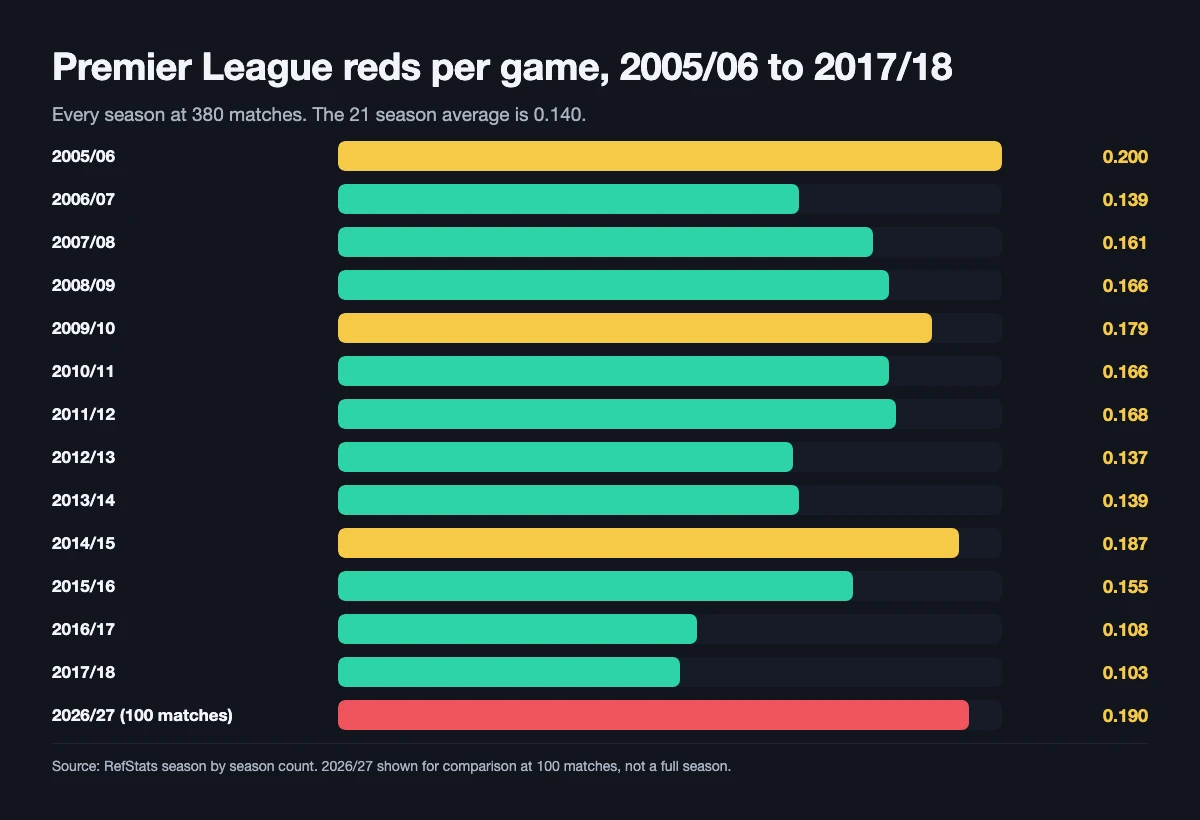
Season by season the series is noisy, which is exactly what a 0.14 per game event looks like over 380 matches. The spread runs from 28 reds in 2022/23 to 76 in 2005/06, and consecutive seasons routinely move by 40 per cent without anything in particular having changed.
| Season | Matches | Reds | Reds per game | Matches with a red |
|---|---|---|---|---|
| 2005/06 | 380 | 76 | 0.200 | 18.9% |
| 2006/07 | 380 | 53 | 0.139 | 12.4% |
| 2007/08 | 380 | 61 | 0.161 | 13.7% |
| 2008/09 | 380 | 63 | 0.166 | 15.0% |
| 2009/10 | 380 | 68 | 0.179 | 14.7% |
| 2010/11 | 380 | 63 | 0.166 | 14.2% |
| 2011/12 | 380 | 64 | 0.168 | 16.3% |
| 2012/13 | 380 | 52 | 0.137 | 11.8% |
| 2013/14 | 380 | 53 | 0.139 | 12.6% |
| 2014/15 | 380 | 71 | 0.187 | 17.4% |
| 2015/16 | 380 | 59 | 0.155 | 14.5% |
| 2016/17 | 380 | 41 | 0.108 | 10.5% |
| 2017/18 | 380 | 39 | 0.103 | 9.2% |
| 2018/19 | 380 | 47 | 0.124 | 11.6% |
| 2019/20 | 380 | 45 | 0.118 | 11.3% |
| 2020/21 | 380 | 46 | 0.121 | 11.1% |
| 2021/22 | 380 | 43 | 0.113 | 11.1% |
| 2022/23 | 380 | 28 | 0.074 | 6.8% |
| 2023/24 | 380 | 57 | 0.150 | 13.9% |
| 2024/25 | 380 | 52 | 0.137 | 12.1% |
| 2025/26 | 380 | 39 | 0.103 | 9.2% |
| 2026/27 so far | 100 | 19 | 0.190 | 18.0% |
Read the bottom two rows together and the headline writes itself. Last season produced 39 reds, equal with 2017/18 for the lowest rate in the sample, and this season has produced 19 in barely a quarter of the fixtures. Projected across 380 matches the current pace gives 72 reds, which would be the most since 2005/06 and only just ahead of 2014/15.
2026/27 is running hot, and 100 matches cannot prove it
This is where most card content stops and where a bettor needs it to continue. A rate is an estimate, and 100 matches is a small sample for an event that happens once every seven or eight games. Treating 0.190 as the new truth would be the same mistake as treating last season's 0.103 as the old one.
Run the arithmetic both ways. If the true rate is still the 21 season average of 0.140, then 100 matches should produce 14.0 reds, and getting 19 or more happens about 12 per cent of the time. That is unremarkable. If the true rate were last season's 0.103, 100 matches should produce 10.3 reds, and 19 or more happens under 1 per cent of the time. That is a genuine break.
| Comparison | Expected reds in 100 matches | Observed | Probability of 19 or more by chance | Verdict |
|---|---|---|---|---|
| Against 2025/26 (0.103) | 10.3 | 19 | 0.9% | Significant |
| Against 21 season average (0.140) | 14.0 | 19 | 12.0% | Not significant |
| Against 2005/06 (0.200) | 20.0 | 19 | Close to even | Indistinguishable |
The honest conclusion is narrow and useful: the sample is comfortably strong enough to say the league is not repeating last season, and nowhere near strong enough to say it has moved above its own long run average. The 95 per cent interval around 19 reds in 100 matches runs from 0.105 to 0.275 per game, and the 21 season average of 0.140 sits inside it.
The within season timing adds one more caution. One red came in August, five in September, eleven in October and two in the two November rounds before the international break. October is also the peak month for yellow cards in our cards per game by season stage study, so part of this is a seasonal pattern arriving on schedule rather than a new regime.
Two other leagues say this is not a rule change
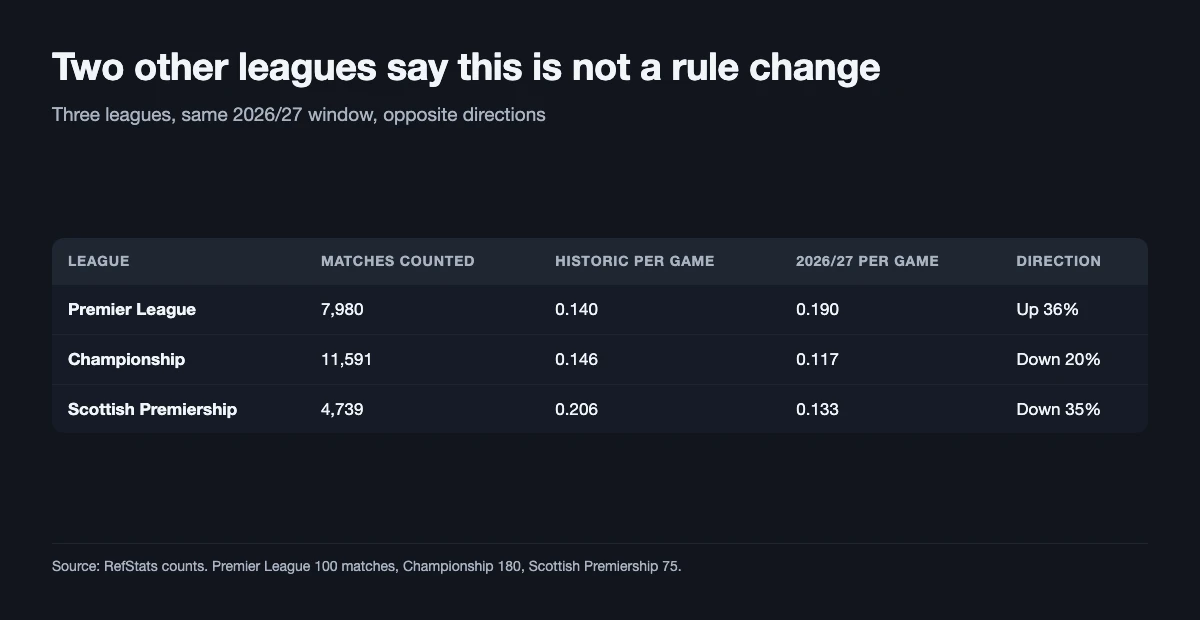
If a sending off had become easier to earn, the effect would show up wherever the same laws are applied. The Championship and the Scottish Premiership are the only other competitions in our data that publish a referee for every match, which makes them a usable control.
Both are running below their own baselines this season.
| League | Matches counted | Historic reds per game | 2026/27 matches | 2026/27 reds per game | Direction |
|---|---|---|---|---|---|
| Premier League | 7,980 | 0.140 | 100 | 0.190 | Up 36% |
| Championship | 11,591 | 0.146 | 180 | 0.117 | Down 20% |
| Scottish Premiership | 4,739 | 0.206 | 75 | 0.133 | Down 35% |
Two things follow. The first is that a change in the IFAB laws on fouls and misconduct cannot explain a move that only one of three British leagues is making. The second is a detail worth keeping: the Scottish Premiership is the real sending off league, historically 0.206 per game against the Premier League's 0.140, which is one red every 4.9 matches against one every 7.1. If you want red card volume, the division matters more than the referee, as our which league has the most cards comparison shows for cards in general.
Premier League red card stats by referee, 2026/27
Twenty one officials have taken a Premier League match this season. Nine of them have shown a red card and twelve have not, and the gap between a referee's current rate and his own record since 2005/06 is the column that actually matters.
| Referee | 2026/27 matches | Reds | Reds per game | Matches since 2005/06 | Career reds per game | Running |
|---|---|---|---|---|---|---|
| John Brooks | 7 | 4 | 0.571 | 74 | 0.122 | 4.7x career |
| Chris Kavanagh | 7 | 4 | 0.571 | 193 | 0.114 | 5.0x career |
| Simon Hooper | 2 | 1 | 0.500 | 140 | 0.071 | 7.0x career |
| Michael Oliver | 8 | 3 | 0.375 | 428 | 0.136 | 2.8x career |
| Peter Bankes | 6 | 2 | 0.333 | 115 | 0.122 | 2.7x career |
| Stuart Attwell | 6 | 2 | 0.333 | 244 | 0.131 | 2.5x career |
| Tom Bramall | 5 | 1 | 0.200 | 52 | 0.173 | 1.2x career |
| Tim Harrington | 5 | 1 | 0.200 | 48 | 0.104 | 1.9x career |
| Craig Pawson | 5 | 1 | 0.200 | 289 | 0.138 | 1.4x career |
| Jarred Gillett | 7 | 0 | 0.000 | 85 | 0.047 | Below |
| Sam Barrott | 7 | 0 | 0.000 | 62 | 0.048 | Below |
| Darren England | 6 | 0 | 0.000 | 99 | 0.111 | Below |
| Rob Jones | 6 | 0 | 0.000 | 110 | 0.100 | Below |
| Paul Tierney | 5 | 0 | 0.000 | 195 | 0.108 | Below |
| Andy Madley | 5 | 0 | 0.000 | 133 | 0.105 | Below |
| Matt Salisbury | 4 | 0 | 0.000 | 61 | 0.131 | Below |
| Farai Hallam | 4 | 0 | 0.000 | 5 | Too few | No baseline |
| Anthony Herczeg | 2 | 0 | 0.000 | 0 | None | No baseline |
| Jacob Smith | 1 | 0 | 0.000 | 8 | Too few | No baseline |
| Lewis Smith | 1 | 0 | 0.000 | 10 | Too few | No baseline |
| Tom Kirk | 1 | 0 | 0.000 | 6 | Too few | No baseline |
Eight of the 19 reds belong to two referees. Brooks sent off two players in one match, Brentford against Liverpool on 17 October, and Kavanagh has produced a red in four separate fixtures. Neither has any history of this: both sit near 0.12 per game across their Premier League careers, which is slightly below the league average.
So the table should be read as a list of candidates for regression, not a strictness ranking. A referee with 193 matches of evidence at 0.114 and seven matches at 0.571 is best estimated at something close to 0.12, not at 0.57. The twelve officials on zero deserve the same scepticism in the other direction, and how referee stats win card bets sets out the sample sizes at which a referee's own number starts to carry weight. Full per season splits for each official sit on their pages and on the Premier League referee list.
Career sending off rates, and why Mike Dean's total moves
Over a long enough record the differences between officials do become real. Among referees with at least 100 Premier League matches since 2005/06, the spread runs from one red every 4.4 matches to one every 14.
| Referee | Matches | Reds | Reds per game | One red every |
|---|---|---|---|---|
| Rob Styles | 111 | 25 | 0.225 | 4.4 matches |
| Phil Dowd | 250 | 54 | 0.216 | 4.6 matches |
| Mike Dean | 476 | 96 | 0.202 | 5.0 matches |
| Mike Riley | 102 | 20 | 0.196 | 5.1 matches |
| Steve Bennett | 139 | 25 | 0.180 | 5.6 matches |
| Lee Probert | 182 | 31 | 0.170 | 5.9 matches |
| Mark Clattenburg | 276 | 44 | 0.159 | 6.3 matches |
| Andre Marriner | 388 | 61 | 0.157 | 6.4 matches |
| Martin Atkinson | 456 | 67 | 0.147 | 6.8 matches |
| Howard Webb | 266 | 30 | 0.113 | 8.9 matches |
| Paul Tierney | 195 | 21 | 0.108 | 9.3 matches |
| Neil Swarbrick | 132 | 11 | 0.083 | 12.0 matches |
| Simon Hooper | 140 | 10 | 0.071 | 14.0 matches |
Mike Dean is the useful case for anyone checking our numbers against a headline. We count 96 Premier League red cards for him, while published career totals run to 114. Both can be right. Dean refereed in the Premier League from 2000 and our records begin in 2005/06, so the dismissals from his first five top flight seasons sit outside the window, and a gap of 18 is close to what that era's higher rate would predict across roughly 100 matches. Every career figure on this page carries the same boundary, which is why we label it rather than calling it an all time total.
Note also that none of the six strictest officials in that table is still refereeing in the Premier League: not one of them appears in this season's list of 21. The historical extremes are not available to referee a fixture this weekend, and the active group is far more tightly bunched.
Away players take 57 per cent of the red cards
Home advantage shows up in the discipline columns as well as the scoreline, and it is stronger for sending offs than for bookings. Across the 21 seasons, away teams collected 644 of the 1,120 red cards.
| Card | Home | Away | Away share | Away to home ratio |
|---|---|---|---|---|
| Red cards | 476 | 644 | 57.5% | 1.35 |
| Yellow cards | 12,163 | 14,566 | 54.5% | 1.20 |
A visiting player is therefore about 35 per cent more likely to be sent off than a home player, where he is only 20 per cent more likely to be booked. That is a meaningful difference if you are pricing a sending off on a specific team rather than on the match, and it is the same asymmetry documented at card level in referee home bias and away team cards.
This season has not repeated it. The 19 reds split 9 home and 10 away, which at this sample size tells you nothing at all.
Turning a red card rate into a priced bet
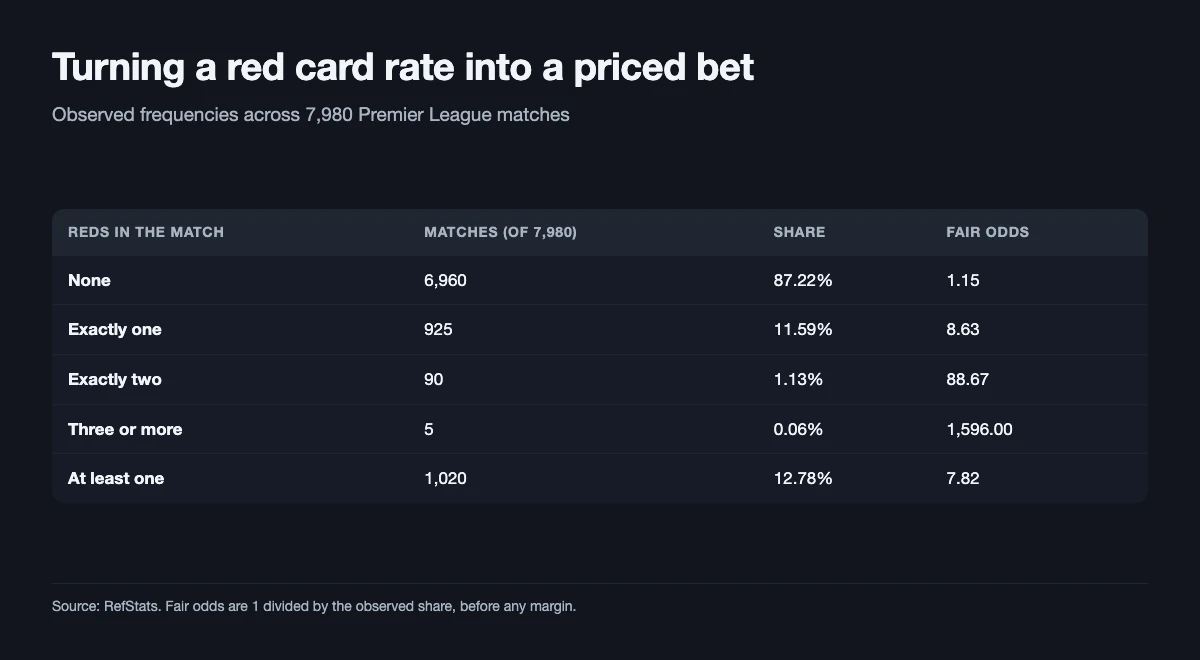
Red card markets are usually offered as a yes or no on a dismissal in the match, so the number you need is not reds per game but the share of matches containing at least one. Those are different quantities, because a sending off sometimes arrives in pairs.
| Reds in the match | Matches (of 7,980) | Share | Fair odds |
|---|---|---|---|
| None | 6,960 | 87.22% | 1.15 |
| Exactly one | 925 | 11.59% | 8.63 |
| Exactly two | 90 | 1.13% | 88.67 |
| Three or more | 5 | 0.06% | 1,596.00 |
| At least one | 1,020 | 12.78% | 7.82 |
So the long run fair price on a red card in a Premier League match is about 7.82, last season's rate priced it at 10.86, and this season's 18 matches in 100 price it at 5.56. The honest range to work with is the gap between 7.82 and 5.56, and anything shorter than about 6.0 is asking you to believe a 100 match sample over 21 seasons.
Two practical notes. Multi red matches are rare enough that a two card market needs roughly 89.0 to be fair, and the five matches in 7,980 with three or more are a reminder that these tails are priced on almost no evidence. Booking points markets treat a red as 25 points against a yellow's 10, so the same dismissal rate moves those lines far more than it moves a simple card count, which our booking points guide works through.
Put a red card read to work
Cards, results and totals on football markets, priced by traders rather than a bookmaker's margin. Open Polymarket
18+. Trading involves risk. That is an affiliate link, not betting advice.
Why our count says 39 and other trackers say 44
Search for last season's red card total and you will find 41, 44 and 48 on different sites. We count 39. Before trusting any of them it is worth knowing that these trackers do not agree with each other either, and that most of them never state what they are counting.
Our figures come from the match record columns published by football-data.co.uk, which log the yellow and red cards shown to players in each fixture. To test them we compared the whole of 2025/26 against My Football Facts, which counts independently.
| 2025/26 measure | Our count | Independent tracker | Gap |
|---|---|---|---|
| Yellow cards | 1,424 | 1,423 | 1 card |
| Tottenham yellows (most) | 101 | 100 | 1 card |
| Arsenal yellows (fewest) | 51 | 50 | 1 card |
| Clubs with no red cards | 5 clubs | 3 named, all 3 in our 5 | No conflict |
| Red cards | 39 | 44 | 5 cards |
The yellow columns agree to within one card in 1,424, so the underlying data is sound. The red gap is a definition gap: dismissals of substitutes and coaching staff, and cards shown after the final whistle, do not all reach a match record built around the two teams on the pitch. The tracker we checked also contradicts itself on the same page, giving 44 reds in one box and 40 sent off players in another.
For a bettor the absolute total matters much less than consistency, because every row on this page is counted the same way across all 22 seasons. A basis that is five cards light in 2025/26 is five cards light in 2014/15 too, so the trend and the fair odds hold. Our methodology page sets out the sources and the known limits in full.
What these red card stats cannot tell you
Three limits are worth stating plainly, because the numbers above are more precise than they are complete.
There are no minutes in this dataset. The match records carry card counts but not timestamps for the domestic leagues, so we cannot tell you how many of these dismissals came after the 80th minute, and a late red has a very different effect on a match than an early one. We also cannot separate a straight red from a second yellow, which matters because the two are produced by different referee behaviour: a second yellow is partly a function of how freely an official books, and a straight red is not.
Nor can a referee explain much of a sending off. One red every seven matches means a season of 20 fixtures contains about three, and the difference between the most and least strict active officials is worth well under one red card across a whole season. Fixture, teams and game state carry more of the variance than the name on the team sheet, and the Premier League referee card stats page is the better starting point for yellows, where referee effects are large and measurable.
Related reading
- Premier League referee card stats 2026/27, every official's yellow card rate and over card lines.
- Cards per game by season stage, the within season drift measured across 59,783 matches.
- Which league has the most cards, nine leagues ranked on cards and booking points.
- Referee home bias and away team cards, the home and away split in detail.
- Booking points explained, why a red is worth 25 and a yellow 10.
- How referee stats win card bets, the sample sizes that make a referee number usable.